How to Use the Whiteboard
The Whiteboard is a strategy board where you place tasks as cards anywhere you like. You can draw in relationships with shapes and sticky notes, or drop in summary widgets to turn it into a dashboard. What sets it apart from a general-purpose online whiteboard is that the cards are not static sticky notes: they continuously show current progress, due dates, and assignees. Update progress in the Gantt chart and the board follows automatically.
1. Creating a Board and Placing Tasks
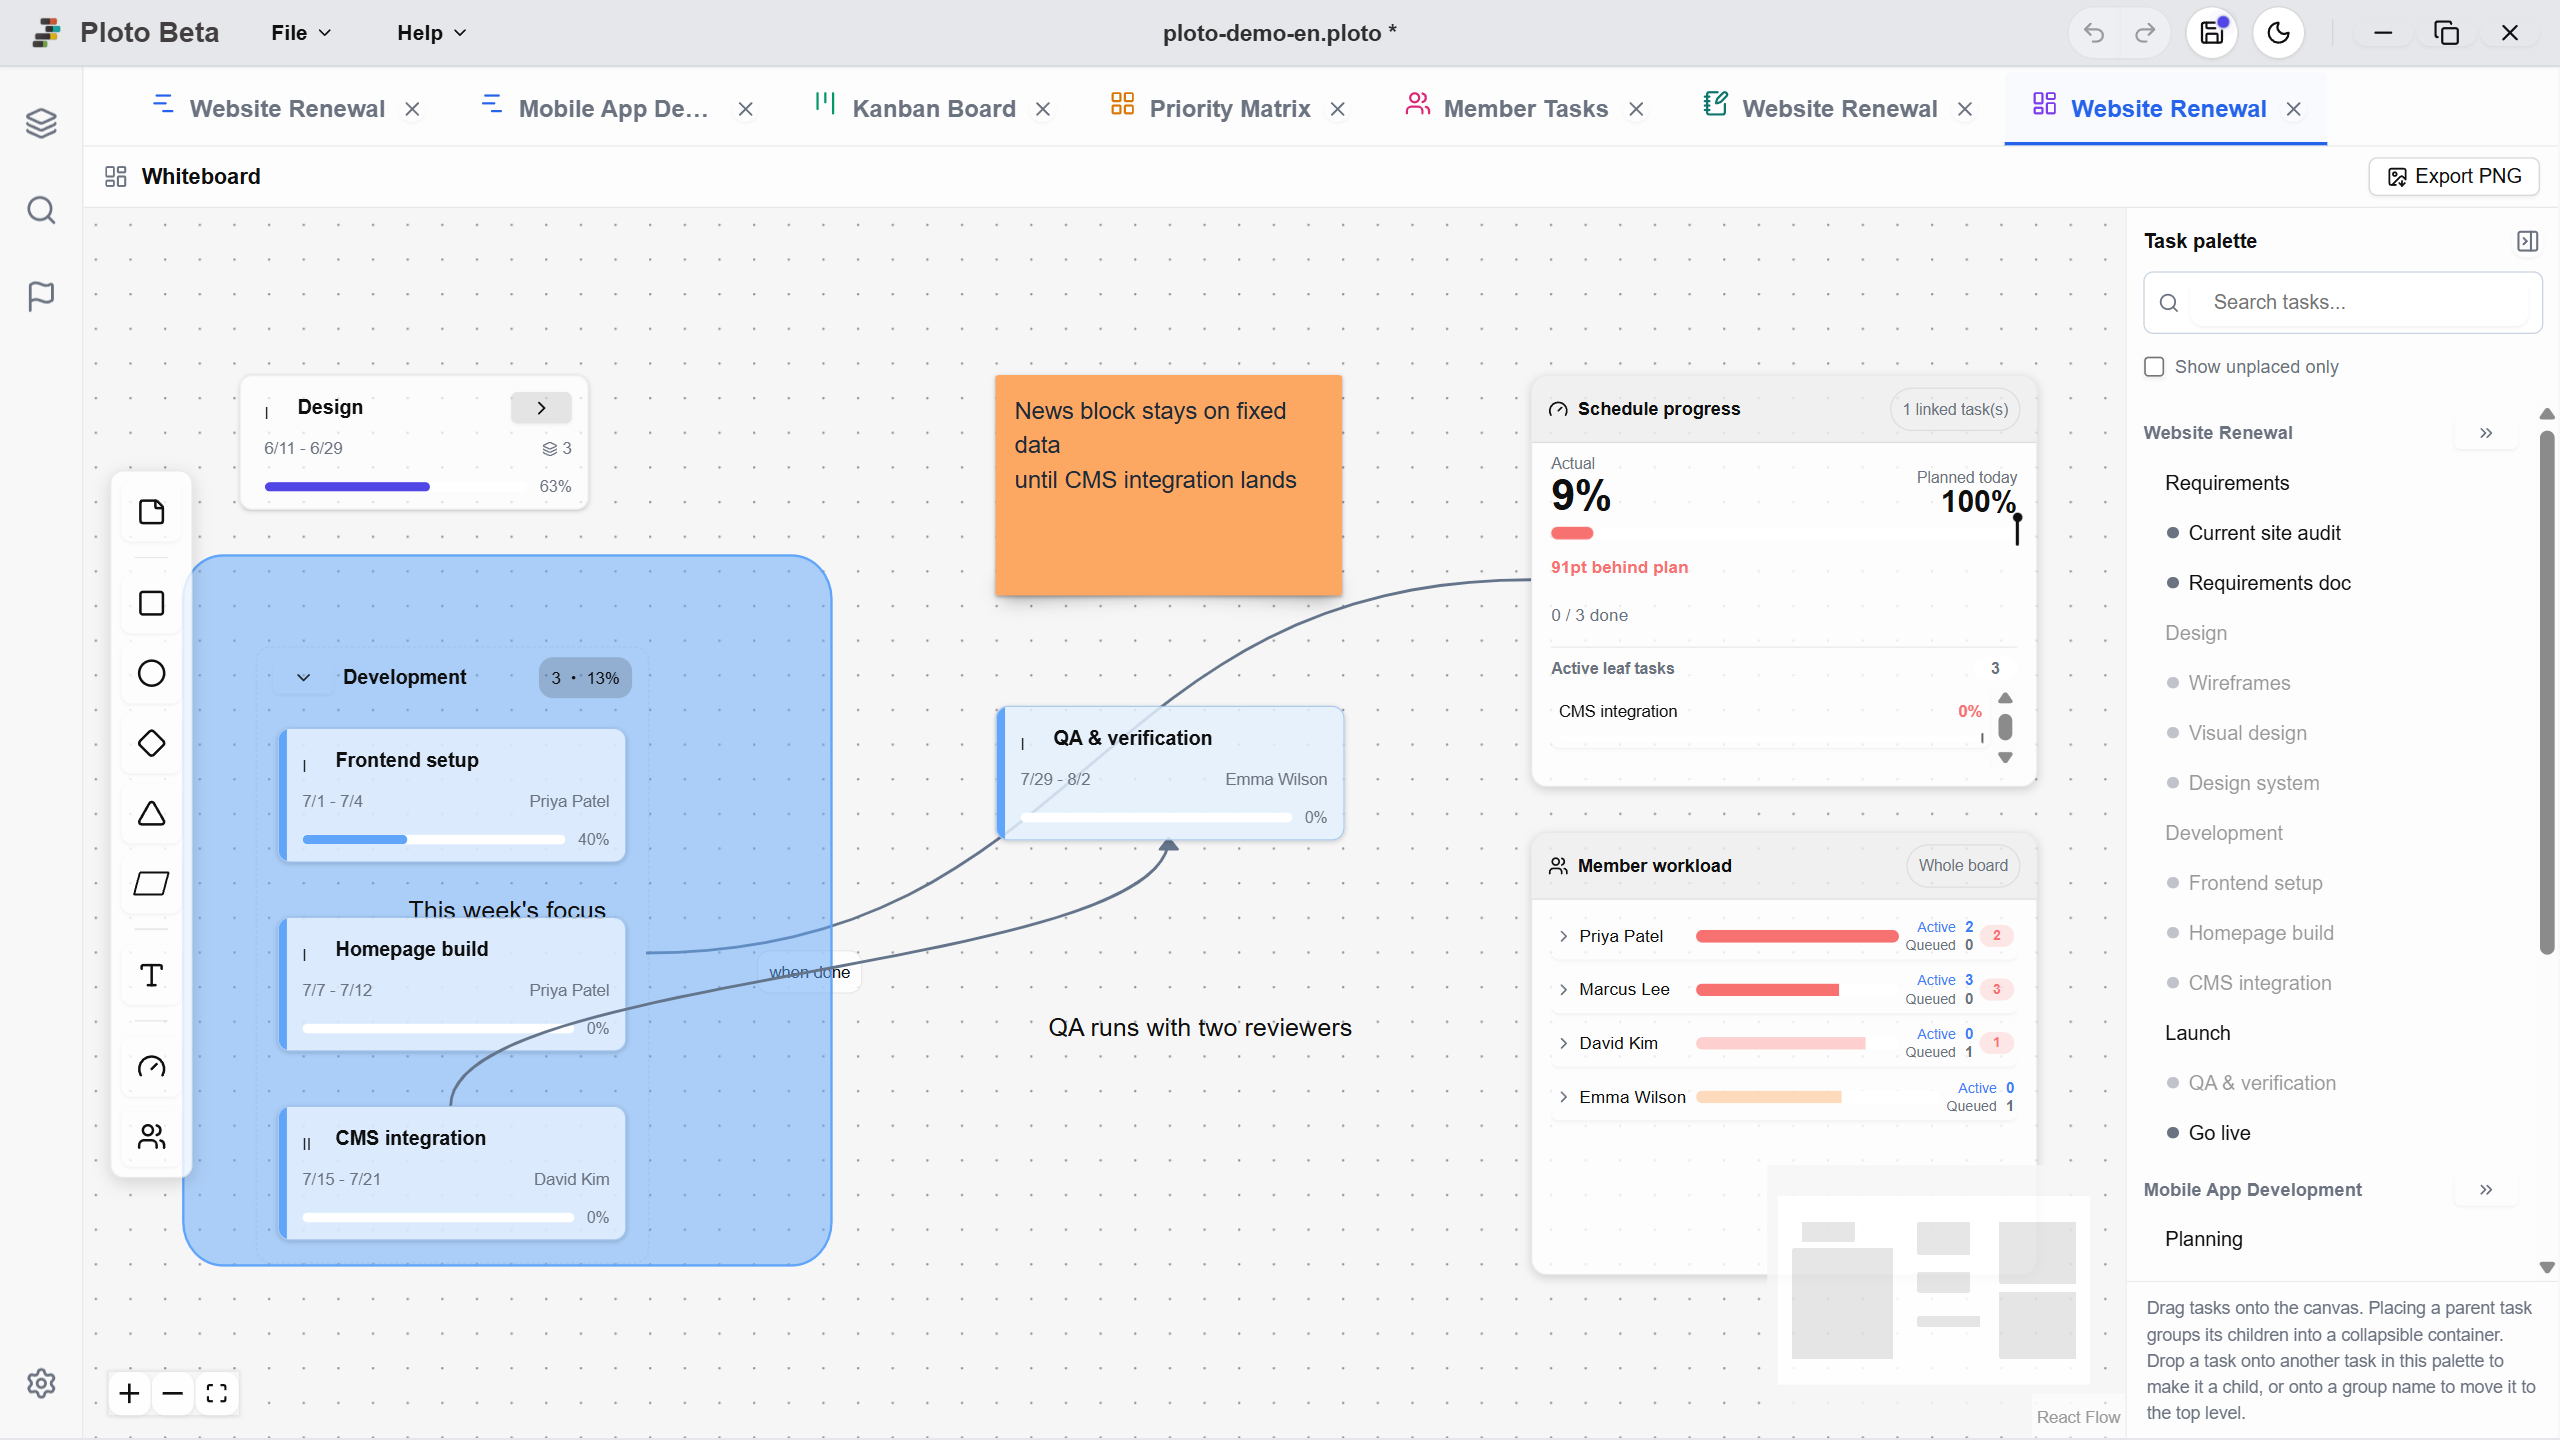
Create a board first, then place only the tasks you actually need on the canvas.
Adding a Whiteboard
Click the 'List' button on the left sidebar, then press the '+' button next to 'Whiteboard'. You can also open it from the switch button on the Gantt chart toolbar.
*The free version lets you create 3 boards in total. This is counted differently from the Kanban board limit: here, deleting a board does not give the slot back — each creation uses one permanently. The remaining count is always shown near the create button, and a confirmation appears before each creation. Once the allowance is used up, boards you created yourself remain fully editable.
Placing Tasks from the Palette
The 'Task palette' on the right lists your project's tasks in their hierarchy. Drag from there onto the canvas to place a card. 'Place whole project' lays them out together following the hierarchy. The palette lets you search by task name or narrow the list with 'Unplaced only', so you can find what you need even with many tasks.
Switching to the tab never scatters every task onto the board automatically — you choose what goes on it.
Parent Tasks Become Containers
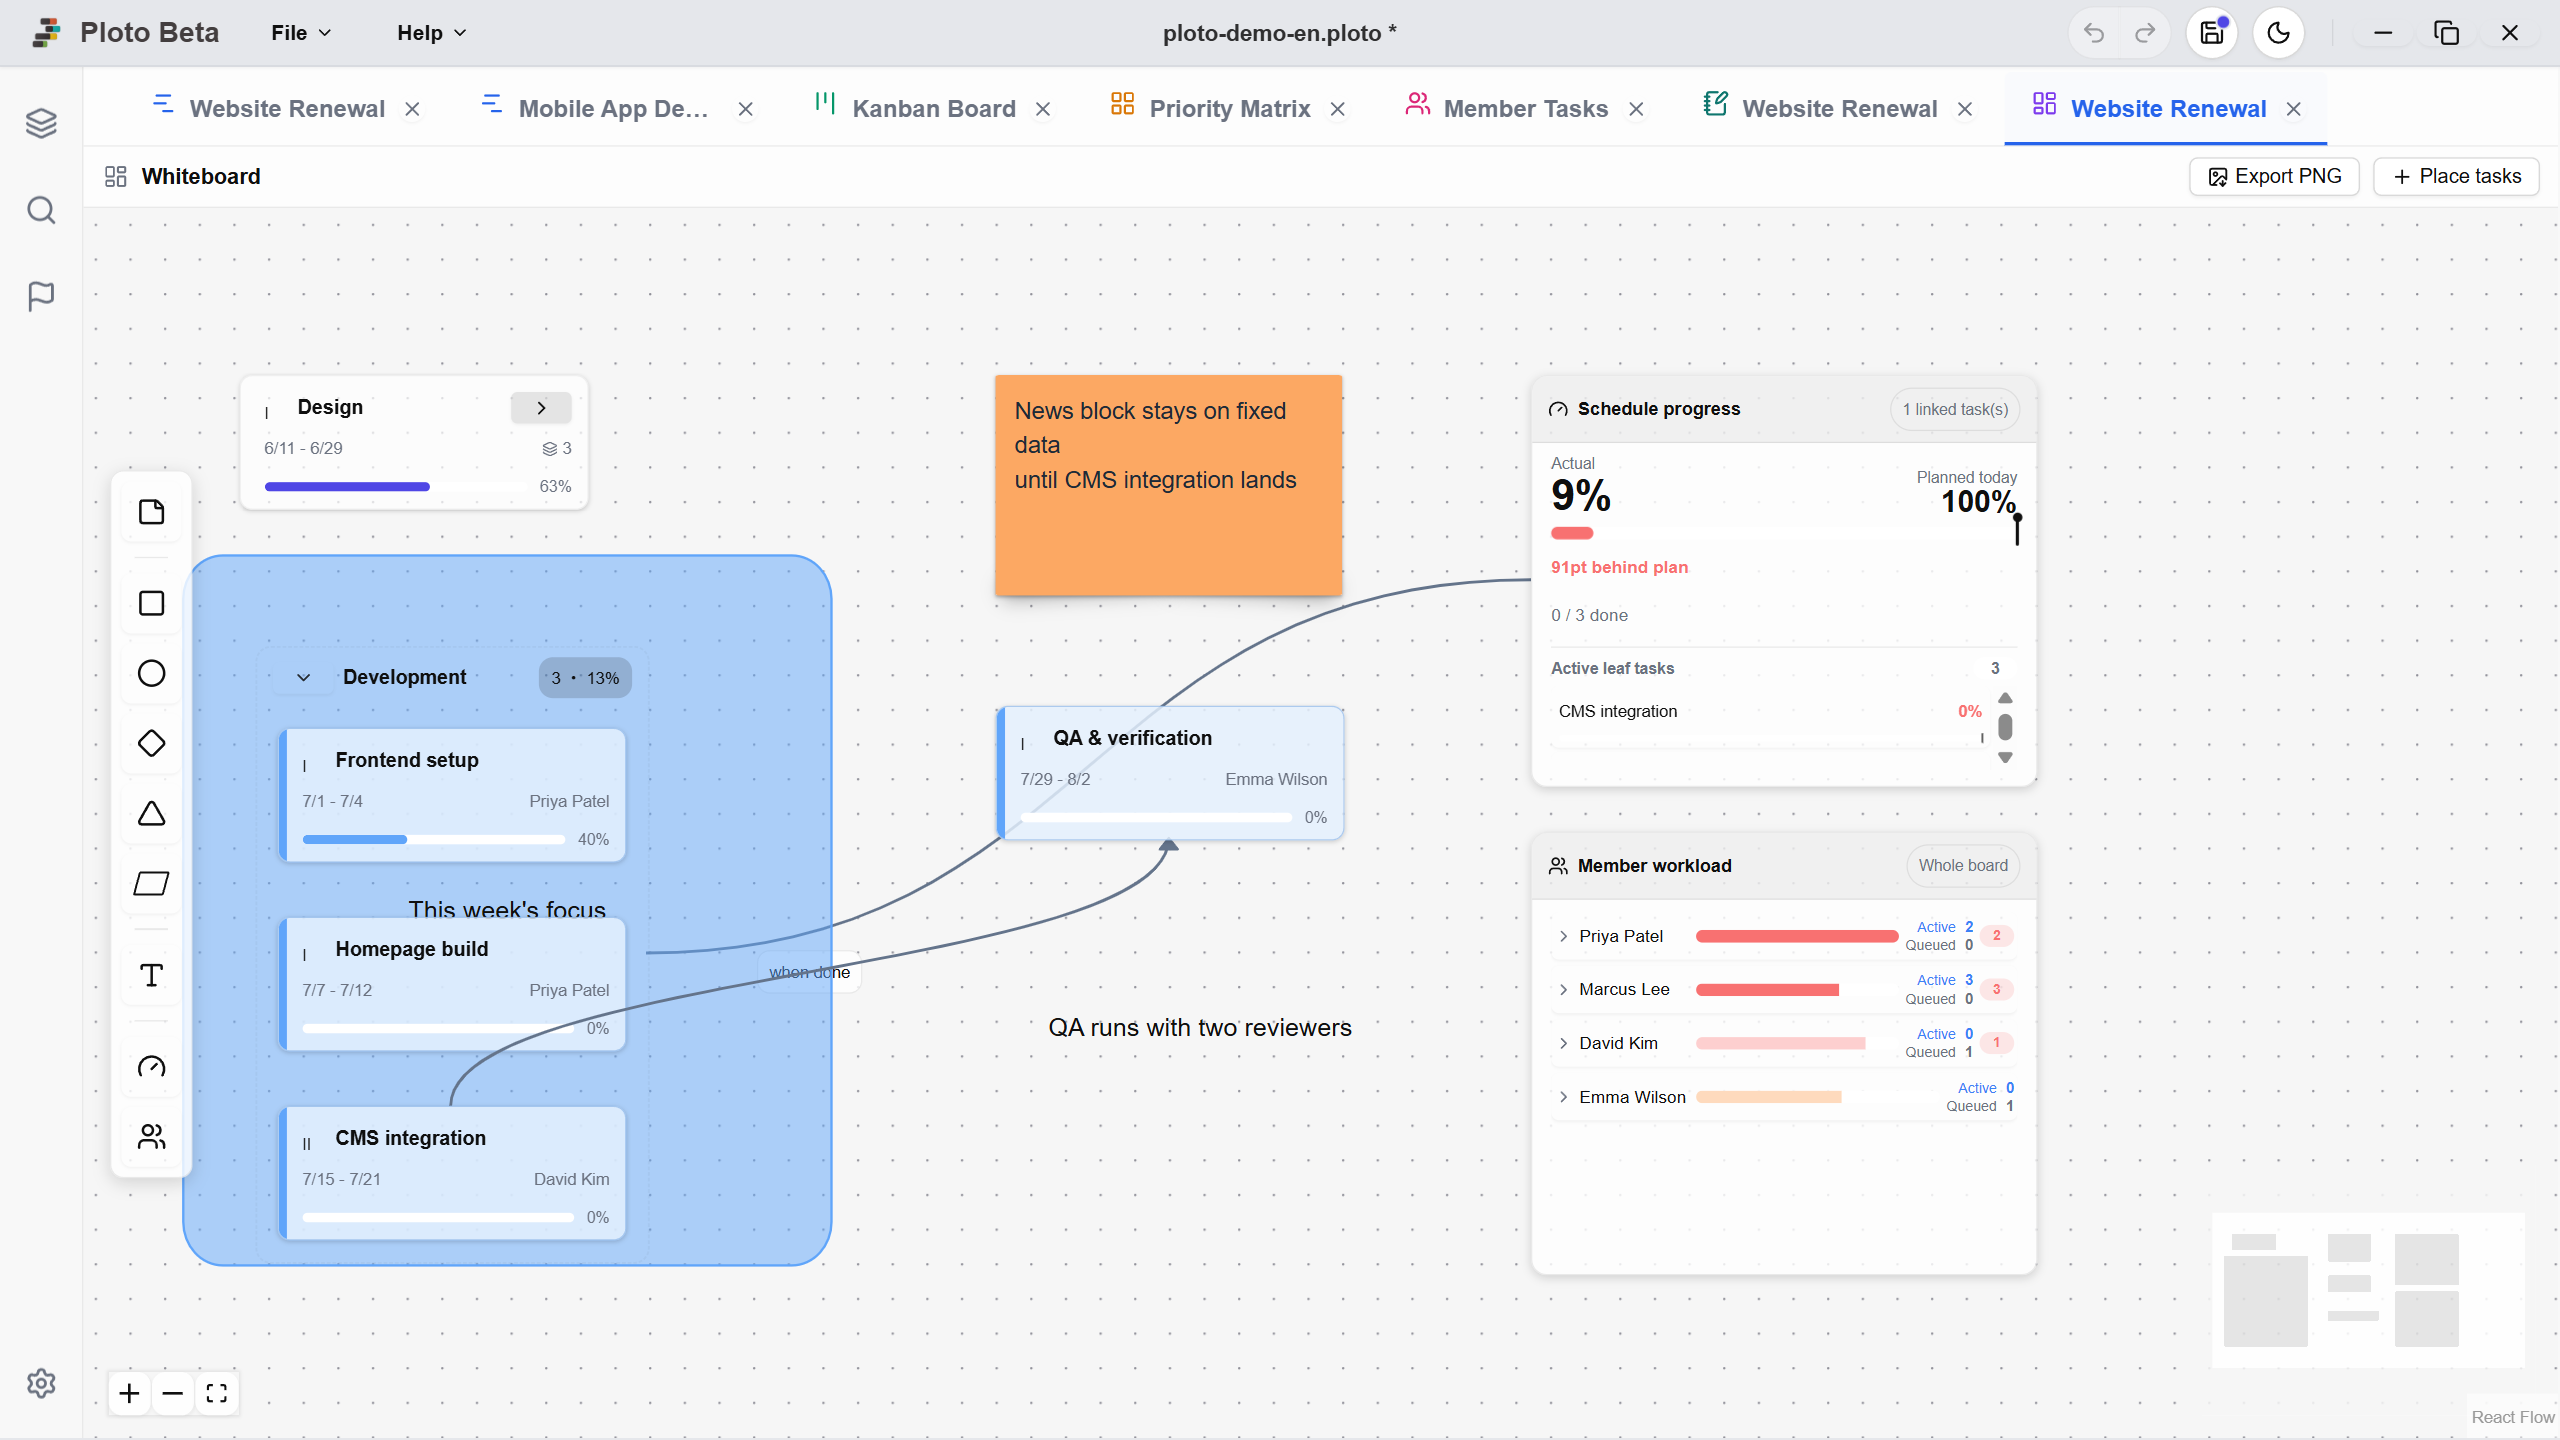
Placing a parent task displays it as a container holding its child tasks. Click the container header to expand or collapse it; collapsed, it shrinks to a single card with badges showing the number of children and their progress. Close containers to survey the whole board, open them to work on the details.
A container always reflects the task's entire subtree, so children you add later in the Gantt chart are filled into it automatically. Because of this, a child task cannot be removed from the board on its own — only the top task of a placed group can be removed.
2. Drawing In Your Thinking
Add the relationships and context that tasks alone cannot express.
Shapes, Sticky Notes, and Text
From the toolbar you can place rectangles, ellipses, diamonds, triangles, parallelograms, sticky notes, and text. Set fill color and opacity, border color, text color, alignment, bold, and italic; fonts can be chosen from default, gothic, mincho, textbook, handwriting, and monospace. Stacking order is adjusted with 'Bring to front', 'Send to back', and so on. Select several shapes and group them to make selection, movement, and deletion act as one.
Sticky notes and text scale their font size when resized. Labels on rectangles and ellipses do not, since resizing those is for creating room inside the box.
Connecting with Connectors
Drag from the edge of a card or shape to link it with a connector. While connecting, markers appear on all four sides of the target, and the line lands on whichever side is closest to where you drop — so it connects where you aimed. Connectors support toggling the arrowhead and adding a label, letting you draw flows such as 'once this is done, next comes this' or handovers between people.
Selecting, Moving, and Scaling
Pan and zoom the canvas freely. Dragging with the right button makes a rubber-band selection; selected items can be moved or deleted together, and dragging a corner of the bounding box scales everything selected proportionally.
Task cards and collapsed containers can be scaled between 25% and 200% by dragging a corner, with text scaling too. Dragging a corner of an expanded container changes the scale of its contents, and nesting multiplies the parent's scale down through it. Making important groups larger and reference material smaller gives the whole board a sense of emphasis. If you misstep, you can undo within the board.
3. Turning the Board into a Dashboard
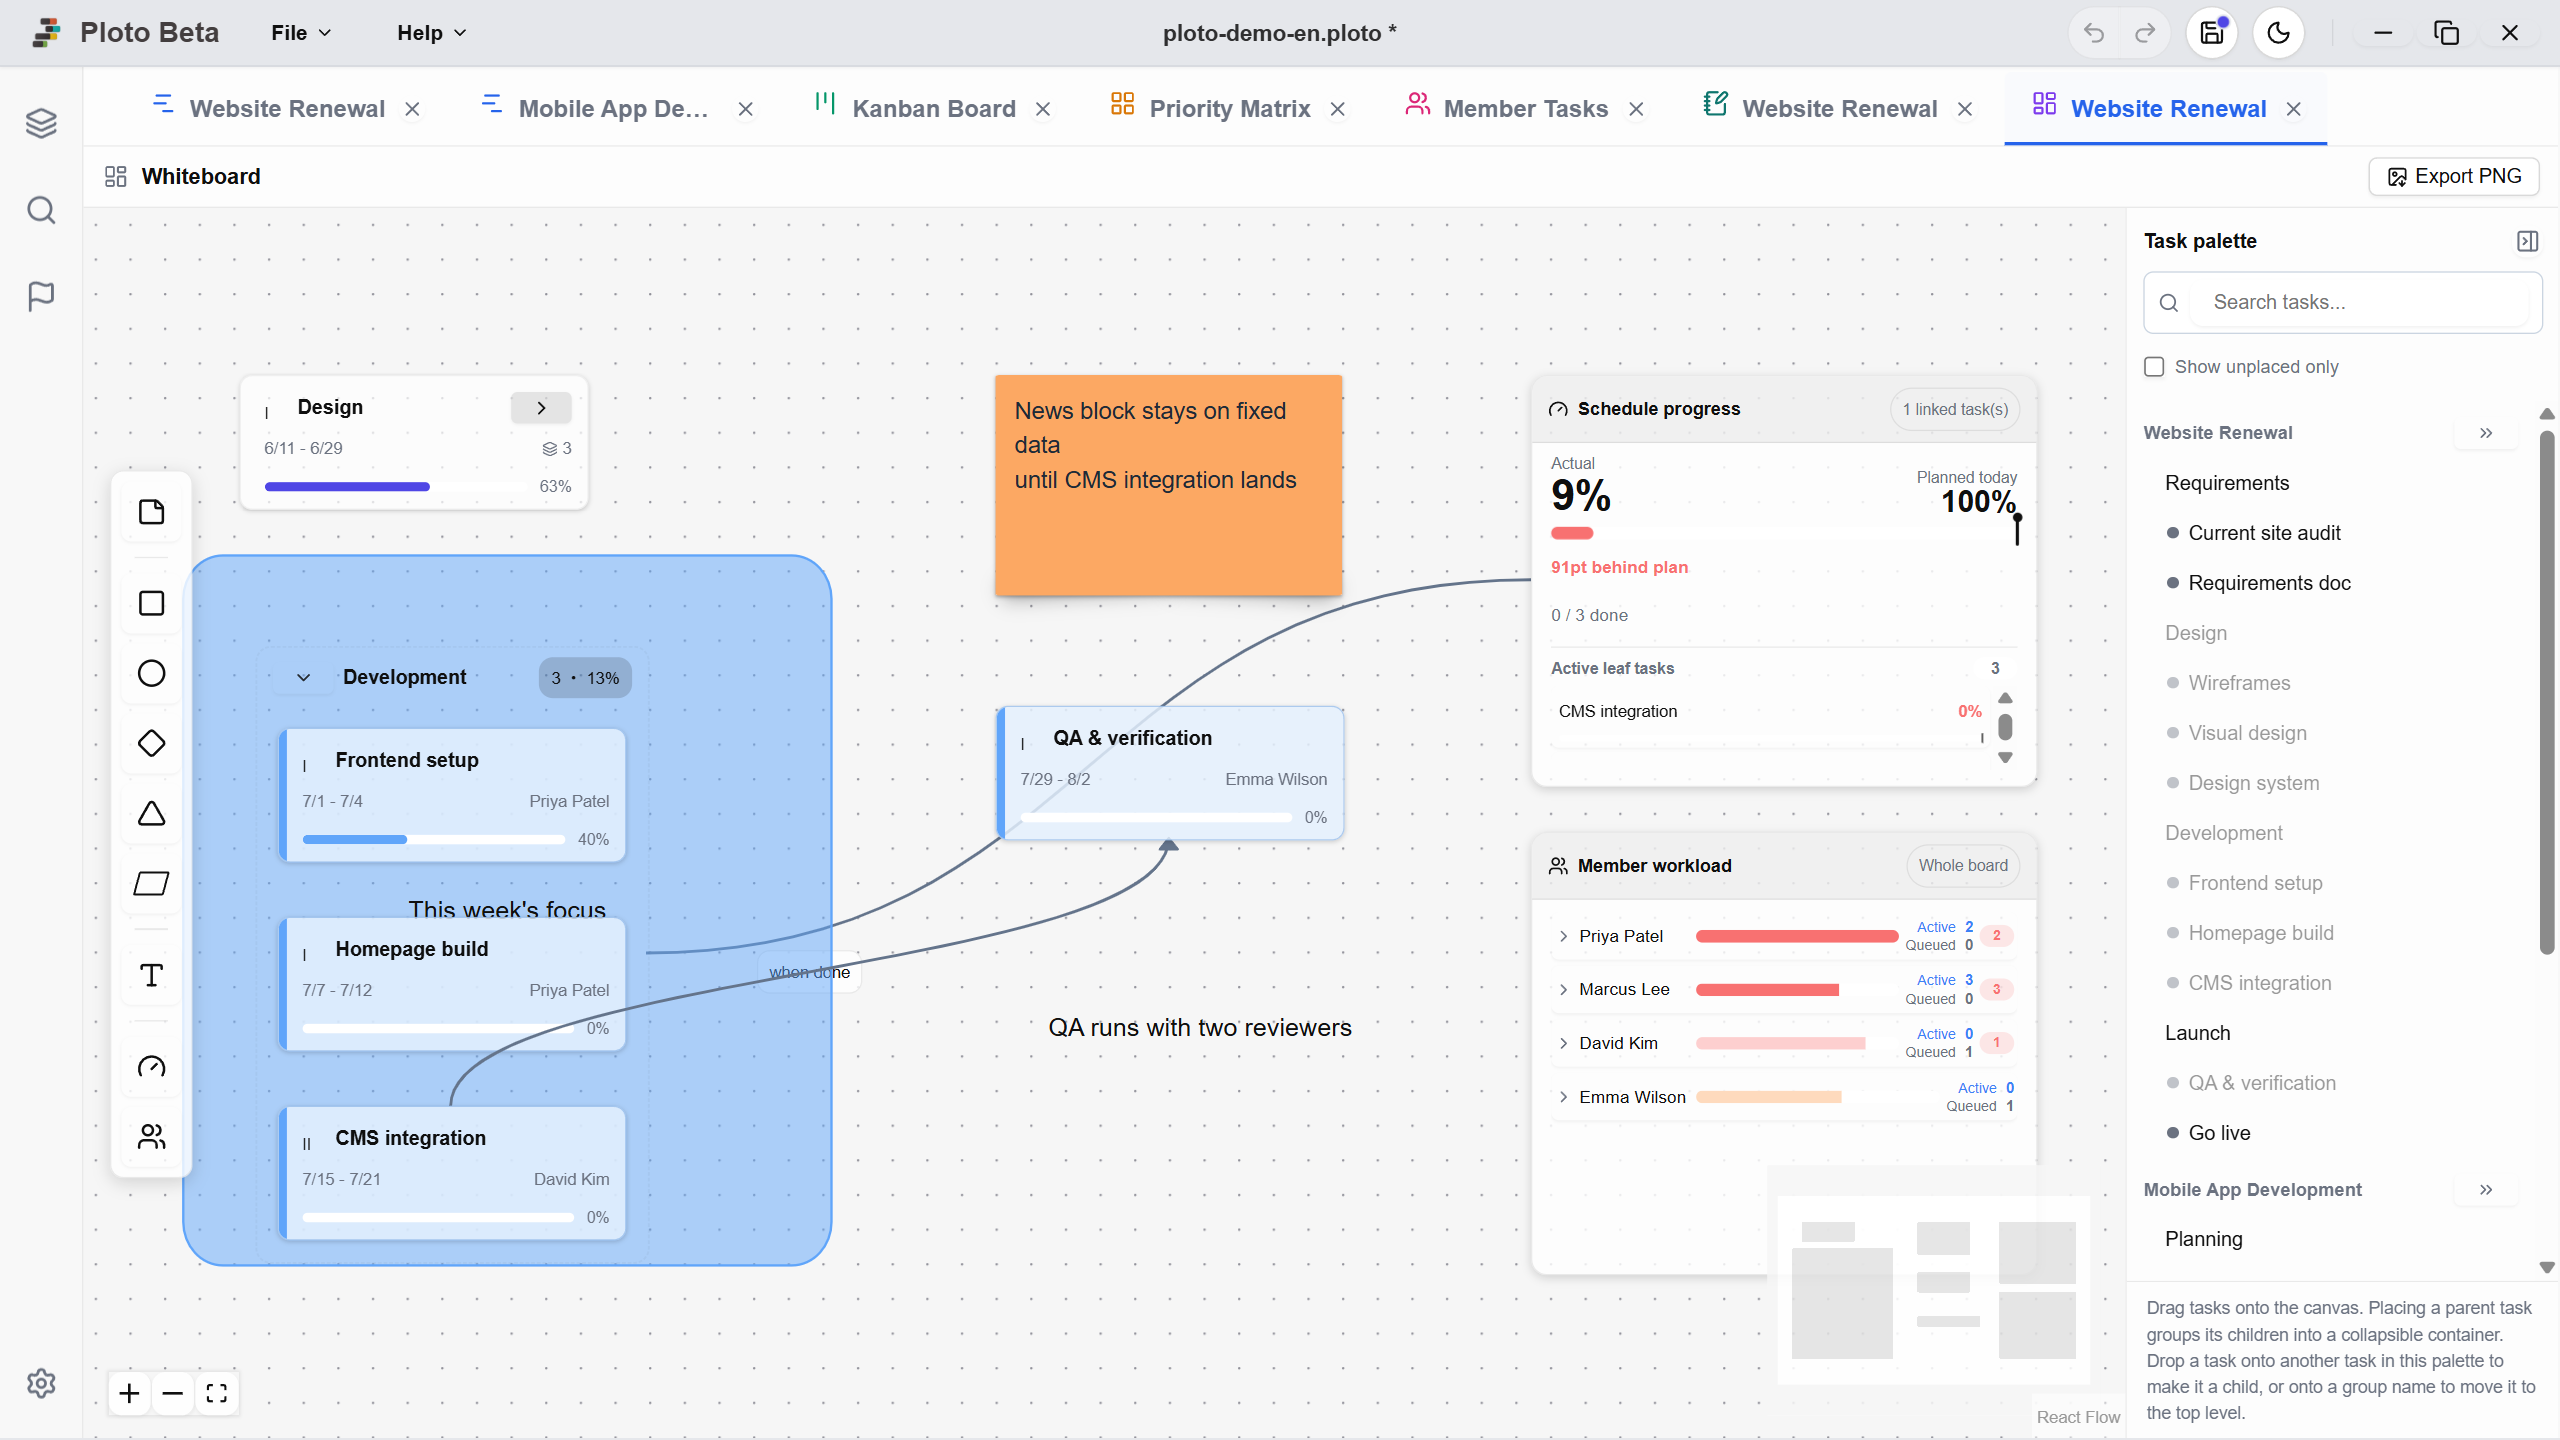
Drop summary panels onto the board and it becomes a progress dashboard you can read at a glance.
Two Widgets
Place them from the widget menu on the toolbar.
Narrowing What a Widget Counts
By default a widget summarizes the whole board. To look at one area, draw a connector from the widget to a task card: only the connected tasks are counted, and removing the line releases them. The count covers the leaf tasks beneath each target, so connecting to a parent task alone reports on that entire group.
Line up widgets per team or per stage and a single board shows several perspectives at once.
Exporting as a PNG Image
The button at the top saves the board as a PNG image. With nothing selected the whole board is exported; with nodes selected, only that area is. Handy for pasting into meeting material or reports.
Sharing and Viewing Boards
Anyone you send the project file to can open the board and see its contents. In the free version, boards created by someone else are view-only, but display, panning, zooming, expanding containers, and live widget figures all still work. If you are sharing a board as a dashboard, the recipient's setup does not matter.